Why analyze your social performance?
Social media generates a constant stream of signals: comments, direct messages, tagged posts, and more. On their own, those signals are just activity. However, when pieced together, they tell you which creators grow your audience and what content contributes to revenue.
Klaviyo paints that full picture within Social Performance (found under Social > Performance). As a marketer, checking in on performance regularly helps you:
- Prove the value of your social program with revenue and engagement.
- Spot strong content early enough to repurpose, boost, or build on it.
- Catch dips in engagement before they settle into a longer-term decline.
- Decide where to spend your time next, with a data-backed decision.
- Identify creators who already talk about your brand and are thus worth building a relationship with.
What is in the Social Performance tab?
The Social Performance tab is organized into a set of reports, with each answering a different question about your program.
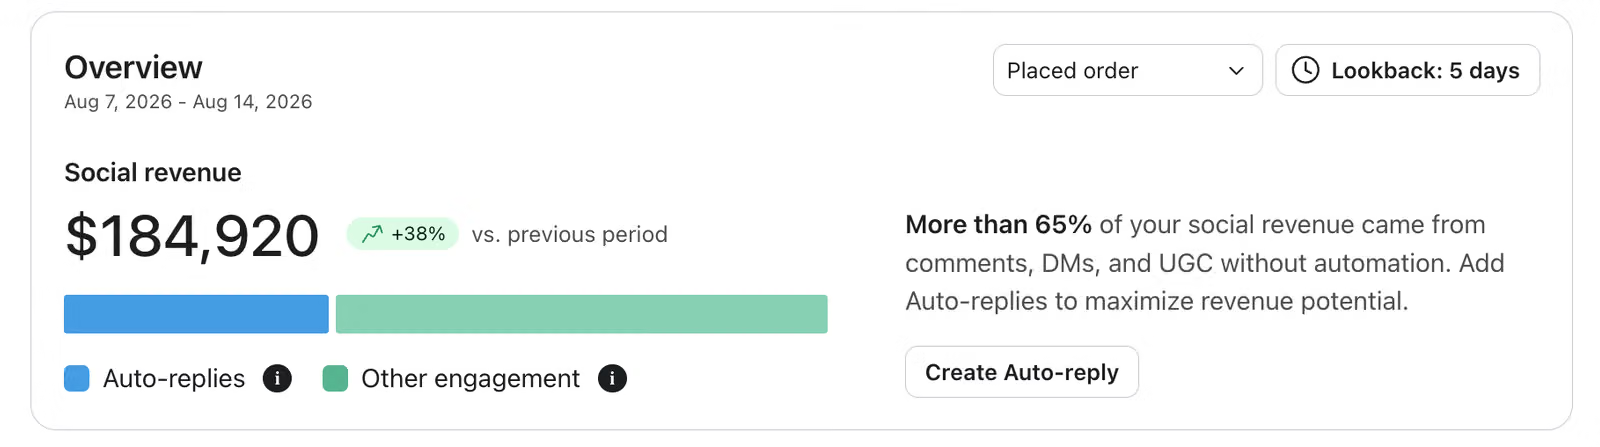
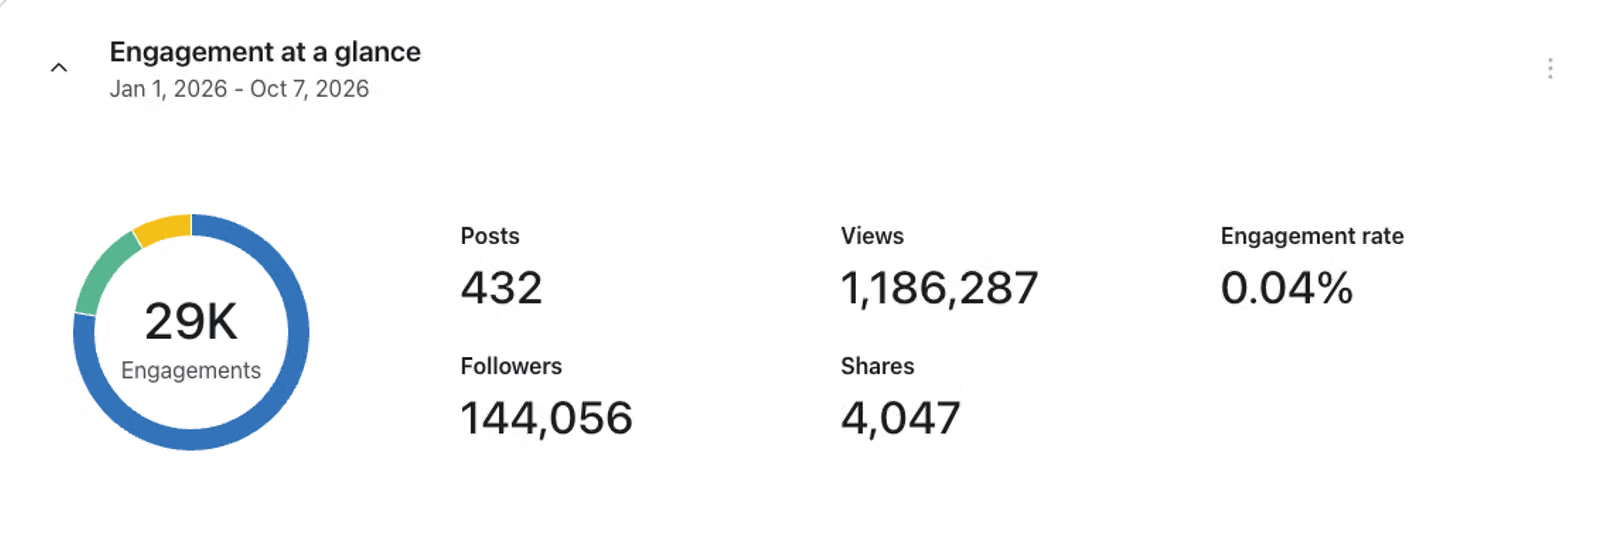
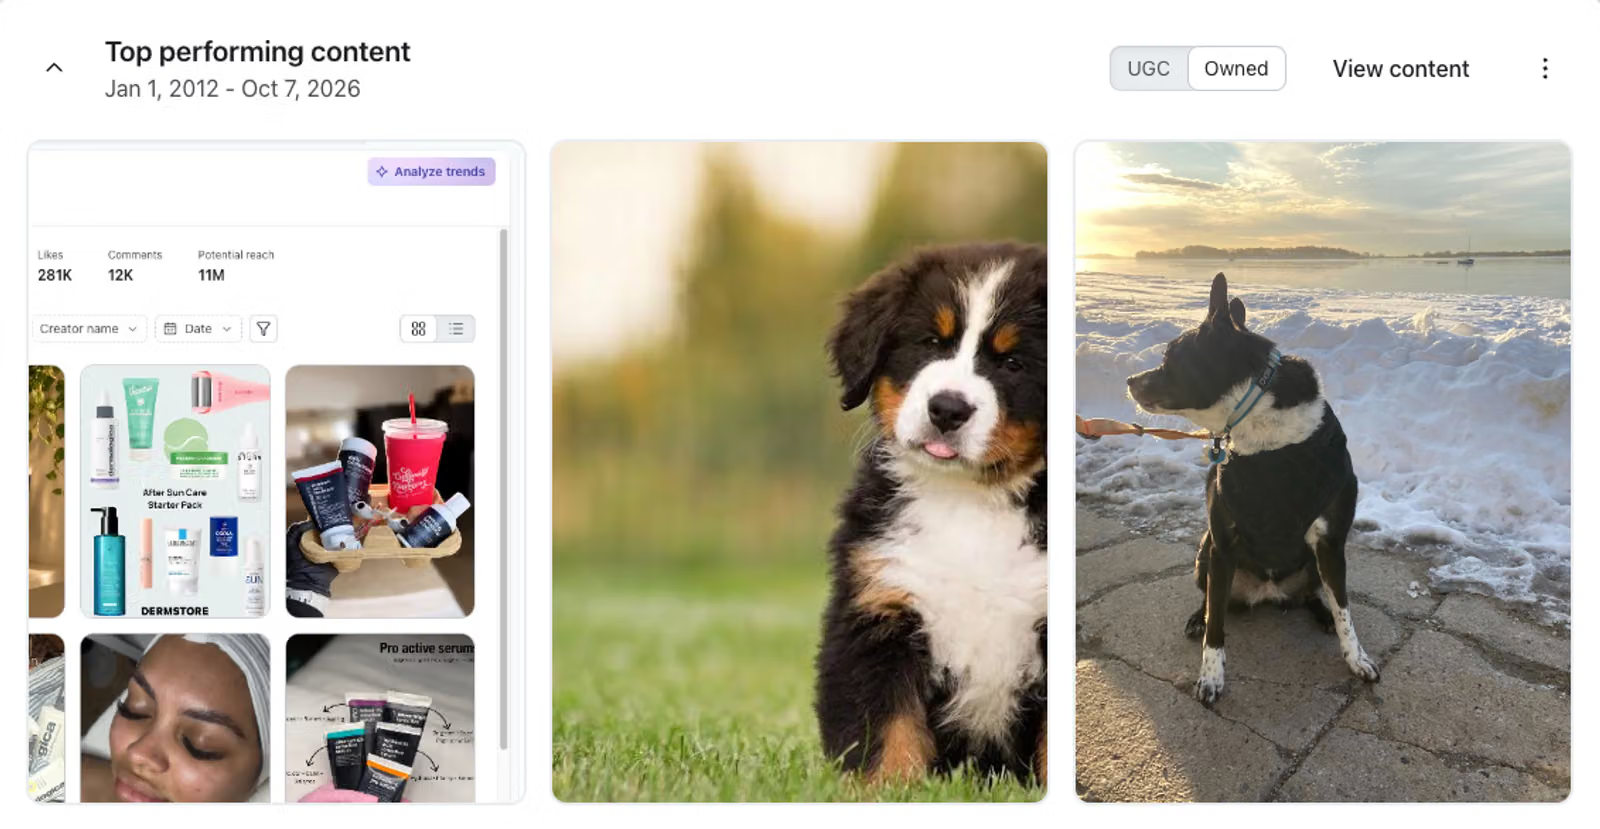
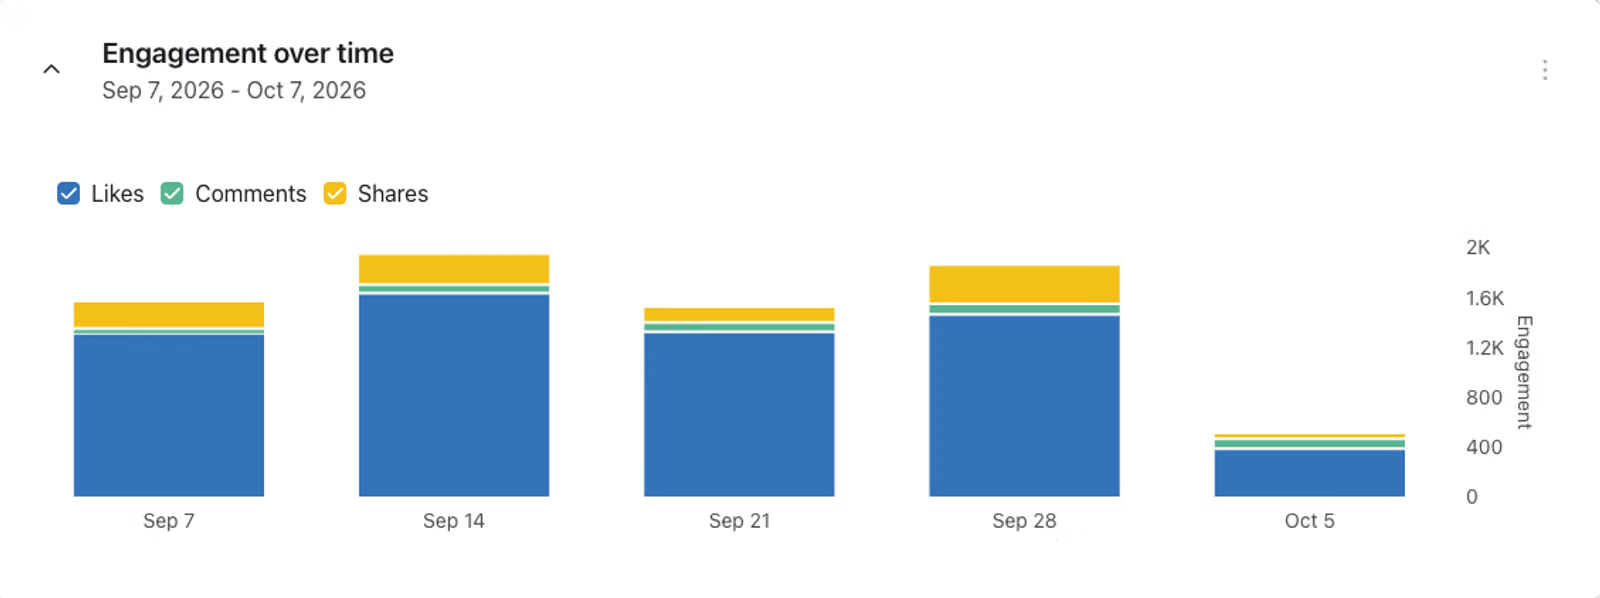
First, focus on a specific date range with the Time period filter, then click through the slides below to better understand what each report tells you.
Take action based on performance
Reporting only pays off when it changes what you do next. Click into the dropdowns below for strategies on what to do based on the insights found in Social Performance, adjusting your strategy whether a post is under- or over-performing.
Improve low engagement on specific content
What you're seeing
A post or a whole content format sits well below your usual engagement rate in Top performing content, or Engagement at a glance shows engagement down against the preceding period.
What to do
- Compare the post against your top performers and look at format, hook, caption length, and posting time, not just the topic.
- Rewrite the opening line and the first frame. Most drop-off happens before someone reaches your message.
- Check whether the post has a clear call-to-action. Content without a clear prompt to comment, save, or reply rarely earns engagement.
- Re-test the idea once with a different execution before you decide the subject doesn't work for your audience.
- Retire formats that underperform consistently rather than posting more of them out of habit.
Maintain high engagement on specific content
What you're seeing
A post or format keeps landing near the top of Top performing content, and its engagement rate holds up across the period rather than spiking once.
What to do
- Write down what made it work (hook, structure, length, tone) and turn it into a repeatable template for your content calendar.
- Add a Social Auto-reply to your highest-engagement posts so comments and DMs convert into email, text, or WhatsApp subscribers.
- Repurpose the winner beyond social: pull the creative and copy into campaigns, flows, and sign-up forms.
- Watch for fatigue. Track the engagement rate on each repeat so you can retire a format before your audience loses interest in it.
- Check Social revenue alongside engagement. Content that draws attention and content that drives purchases are not always the same posts.
Act upon viral trends you're seeing
What you're seeing
Engagement over time shows a sharp spike, or a single post pulls far ahead of your baseline in Top performing content.
What to do
- Move within hours, not weeks. Attention windows on social are short, and a spike is a temporary invitation.
- Reply to comments and direct messages while the post is still active. Conversation keeps it circulating.
- Turn the moment into list growth. Set up a Social Auto-reply with a keyword so people commenting can opt into email, text, or WhatsApp.
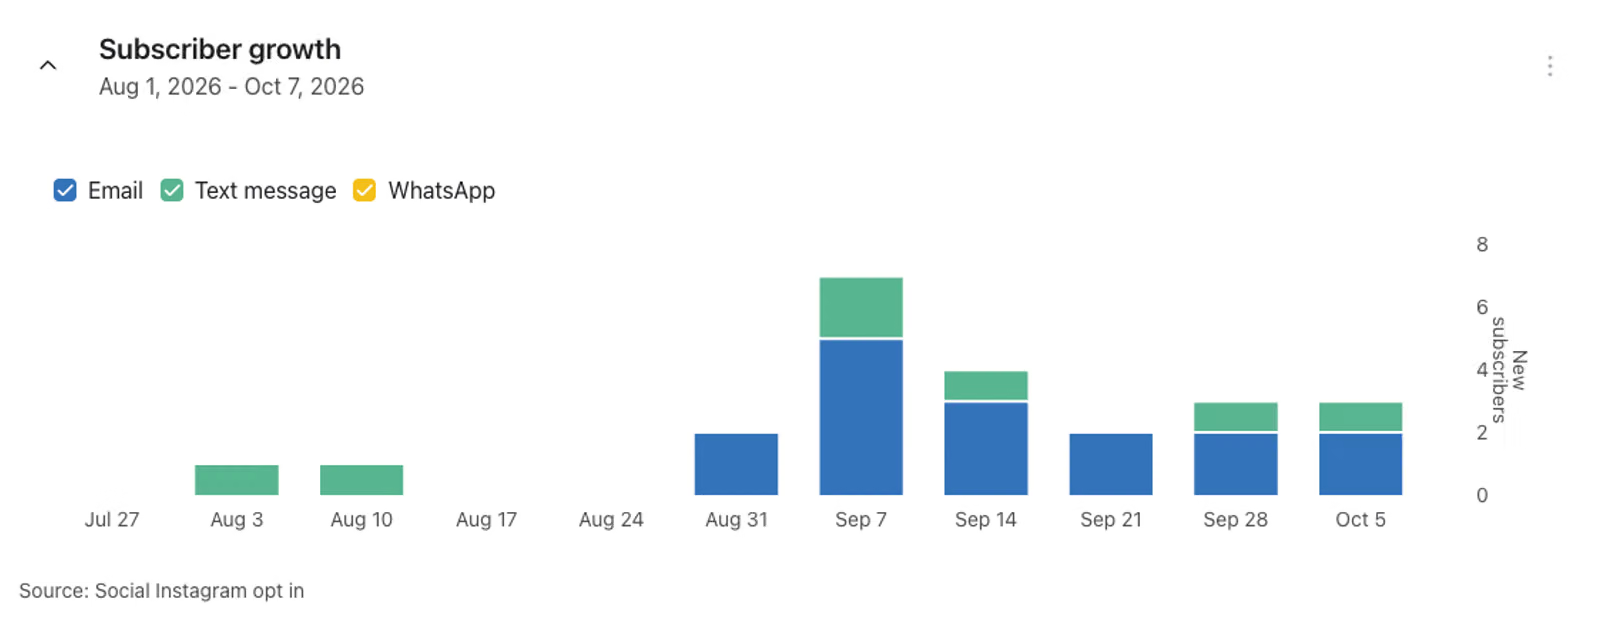
- Check Subscriber growth and Social revenue after the spike to see whether the attention turned into subscribers and purchases, or stopped at views.
- Follow up with a campaign to the profiles you gained while the context is still fresh for them.
Strategize social media creator outreach
What you're seeing
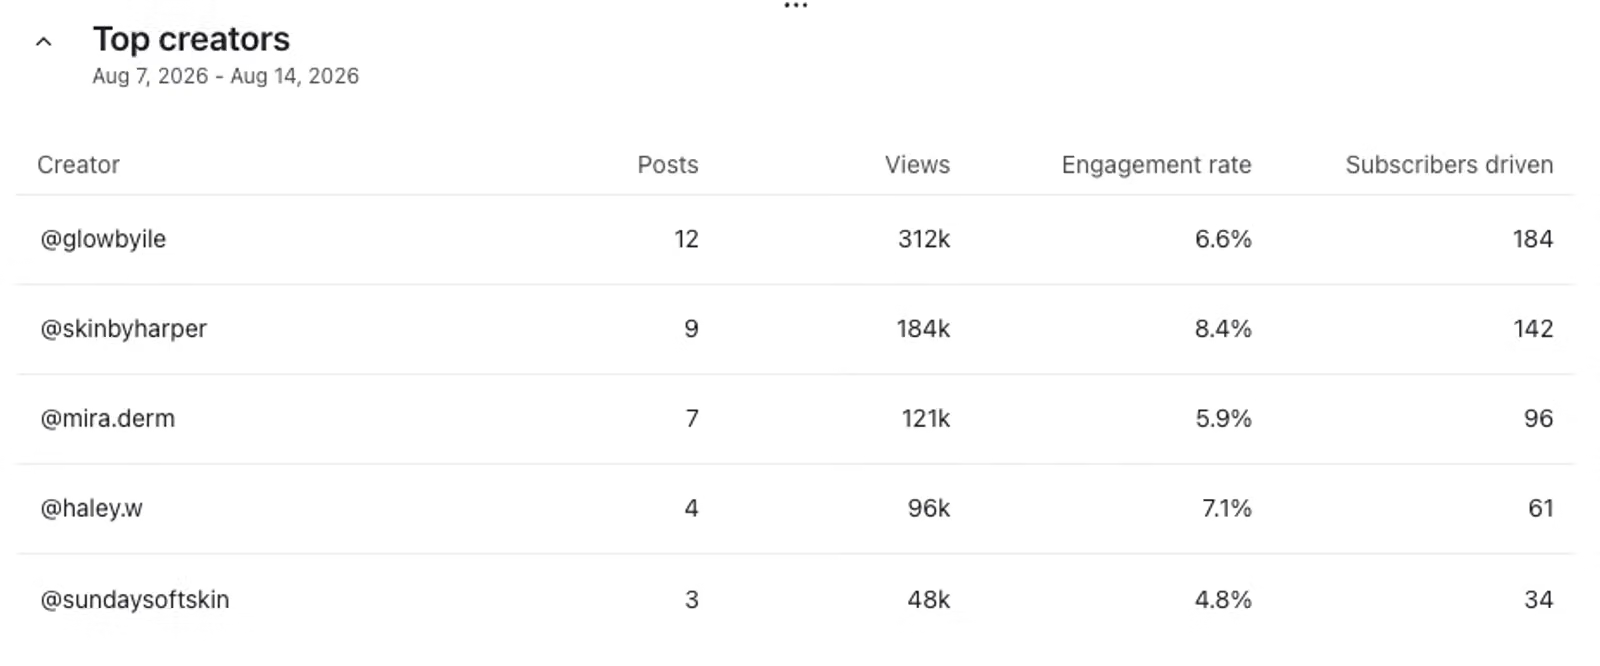
Top creators lists accounts already tagging your brand, ranked by followers, engagement per post, and brand mentions. These are people choosing to talk about you without being asked.
What to do
- Sort by engagement per post before follower count. A smaller, highly engaged audience usually outperforms a large passive one.
- Treat repeat brand mentions as a sign of genuine affinity. Those creators are your warmest outreach list.
- Record creator consent before you reuse anyone's content, so their UGC can safely run in your emails, SMS, and forms.
- Compare UGC against your owned content in Top performing content to see which creator posts are worth amplifying.
- Revisit the report monthly. Creator relationships compound, and the list shows you who is still showing up for your brand.